Business Intelligence Overview
- Definition
- Architecture
- Source systems /OLTP
- ETL process
- Data Warehouses /OLAP
- OLTP vs. OLAP
- ODS and Data Marts
- Data Warehouse Design Approaches
- Dimensional Modeling
- From Enterprise models to Dimensional models
- Schema Types: Star, Snowflake, Fact Constellation
- Conclusion
Definition
The term business intelligence (BI) refers to technologies, applications and practices for the collection, integration, analysis, and presentation of business information. The purpose of business intelligence is to support better business decision making. BI systems provide historical, current, and predictive views of business operations, most often using data that has been gathered into a data warehouse or a data mart and occasionally working from operational data.
BI enables enterprises
- Measure performance and trends
- To use analytic information strategically
- Unlock the value of its information
- Identify opportunities
- Improve efficiency
- Do competitive analysis..
- to find the Cause
- data Mining
- Etc.
Examples
- Cause & predictive analysis: Credit cart annual fee
- Performance and trends: Region total sales / our sales
- Competitive: Our sales / competitor sales in a particular region or a location, etc,
- Right timing: Bank customer accounts (pattern changes)
- Data mining: market basket analysis
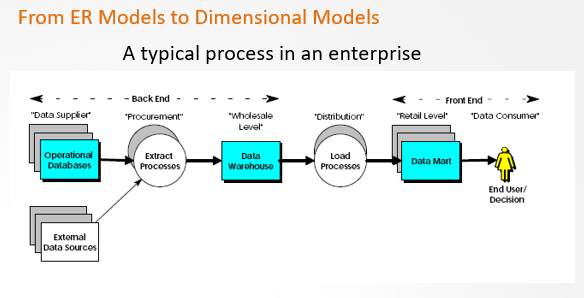
Architecture
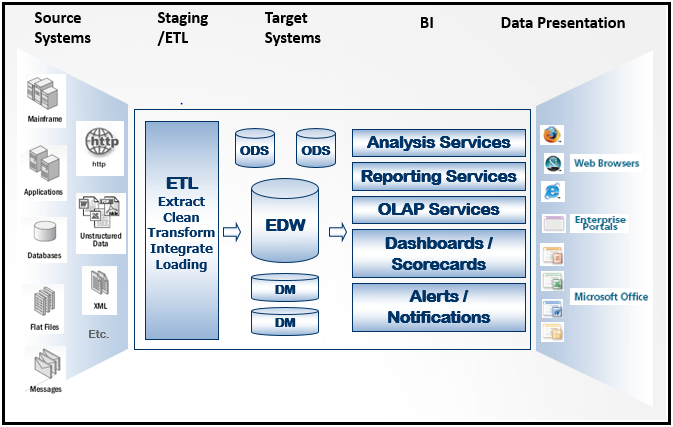
Architecture cont…
Typical BI architecture has the following components:
• A source system, also called Operational system—typically an online transaction processing (OLTP) system, but other systems or files that capture or hold data of interest are also possible.
• An extraction, transformation, and loading (ETL) process.
• A data warehouse—typically an online analytical processing (OLAP) system.
• A business intelligence platform such as Microstrategy.
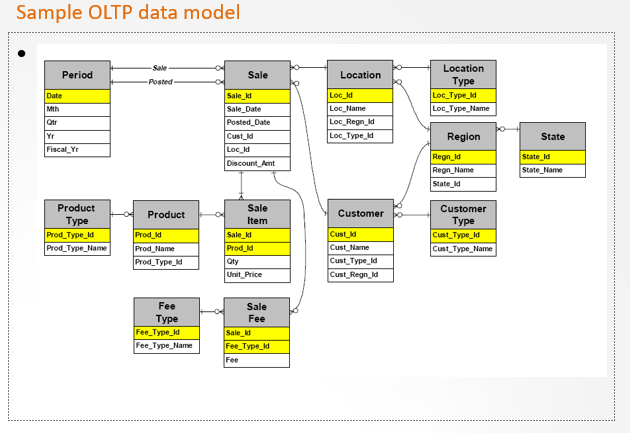
Source Systems (OLTP)
An operational system is a term used in data warehousing to refer to a system that is used to process the day-to-day transactions of an organization. These systems are designed so processing of day-to-day transactions is performed efficiently and the integrity of the transactional data is preserved.
Sometimes operational systems are referred to as operational databases, transaction processing systems, or on-line transaction processing systems (OLTP). In OLTP — online transaction processing systems relational database design use the discipline of data modeling and generally follow the Codd rules of data normalization in order to ensure absolute data integrity.
Source Systems examples
- Account transactions in a Bank
- Sales transactions in a Retail outlet.
- Inventory management transactions in a warehouse
- Workforce management transactions such as attendance, vacations, overtime tracking, etc.
- Operational expenditure systems
- External sources such as industry information like elasticity or demand of a product from a third part sources in Retail domain.
- Etc.
ETL – Extraction, Transformation and Loading
The Extraction, Transformation, and Loading (ETL) process represents all the steps necessary to move data from different source systems to an integrated data warehouse.
The ETL process involves the following steps:
- Data is gathered from various source systems.
- The data is transformed and prepared to be loaded into the data warehouse. Transformation procedures can include converting data types and names, eliminating unwanted data, correcting typographical errors, aggregating data, filling in incomplete data, and similar processes to standardize the format and structure of data.
- The data is loaded into the data warehouse.
Data Warehouse (OLAP)
A Data Warehouse, in its simplest perception, is no more than a collection of the key pieces of information used to manage and direct the business for the most profitable outcome.
- According to Bill Inmon, “a data warehouse is a
- subject-oriented,
- integrated,
- nonvolatile,
- time-variant
collection of data in support of management decisions”.
- Ralph Kimball states that a data warehouse is “ a copy of transaction data specifically structured for Query and Analysis”.
OLAP
OLAP: a category of software tools that provides analysis of data stored in a database. OLAP tools enable users to analyze different dimensions of multidimensional data. For example, it provides time series and trend analysis views. OLAP often is used in data mining.
OLAP Analysis
Imagine an organization that manufactures and sells goods in several states of USA
During the OLAP analysis, the top executives may seek answers for the following:
- Number of products manufactured.
- Number of products manufactured in a location
- Number of products manufactured on time basis within a location.
- Number of products manufactured in the current year when compared to the previous year.
- Sales Dollar value for a particular product.
- Sales Dollar value for a product in a location.
- Sales Dollar value for a product in a year within a location.
- Sales Dollar value for a product in a year within a location sold or serviced by an employee.
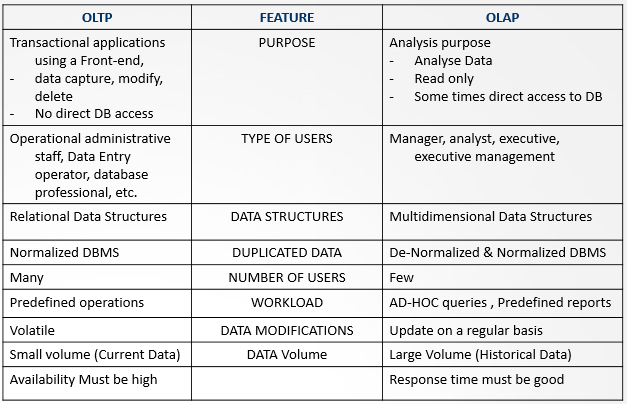
OLTP / OLAP
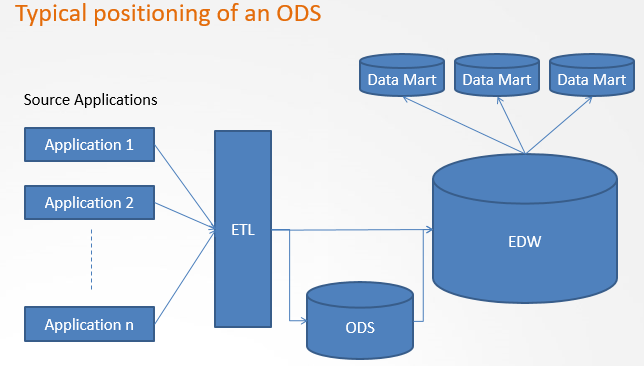
DW related: ODS and Data Marts
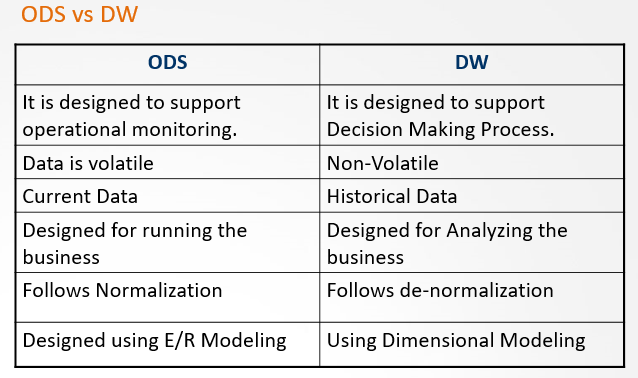
ODS (Operational Data Store) - This has a broad enterprise wide scope, but unlike the real enterprise data warehouse, data is refreshed in near real time and used for routine business activity.
Data Mart – is a subset of data warehouse and it supports a particular region, business unit or business function
ODS and DW use case
In a pharmaceutical company
Customer ODS is used for:
- sending new product details,
- promotional activities,
- and scheduling appointments.
DW is used to answer:
- In a month, what is the total value of medicines prescribed by a Doctor?
- What is our company share
- Is he missing any info from us.
Data Warehouse design approaches
Kimball - Let everybody build what they want when they want it, we'll integrate it all when and if we need to. (BOTTOM-UP APPROACH)
Pros: fast to build, quick ROI, nimble
Cons: harder to maintain as an enterprise resource, often redundant, often difficult to integrate data marts
Inmon - Don't do anything until you've designed everything. (TOP-DOWN APPROACH)
Pros: easy to maintain, tightly integrated
Cons: takes way too long to deliver first projects, rigid
Dimensional data modeling
• Dimensional data modeling is
– A logical design technique
that seeks to
– present the data in a standard frame work
that is
– intuitive and allows high-performance access.
• A data model specifically for designing data warehouses
• The method was developed based on observations of practice, and in particular, providing data in “user-friendly” form.
Step 1. Classify Entities
Transaction Entities
- An event happened at a point of time
- contains measurements or quantities
Component Entities :
- directly related to a transaction entity
- Component entities answer questions like “who”, “what”, “when”, “where”, “how” and “why” of a business event.
In a sales application transaction entities are:
Customer: who made the purchase
Product: what was sold
Location: where it was sold
Period: when it was sold
Classification Entities:
- related to component entities by a chain of one-to-many relationships
- represent hierarchies embedded in the data model
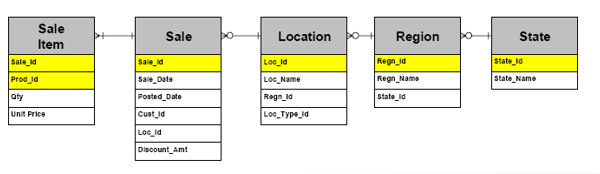
Step 2. Identify Hierarchies
• A hierarchy in an Entity Relationship model is any sequence of entities joined together by one-to-many relationships, all aligned in the same direction.
Step 3. Produce Dimensional Models
Operators For Producing Dimensional Models
Operator 1: Collapse Hierarchy
Operator 2: Aggregation
There is a wide range of options for producing dimensional models from an Entity Relationship model.
These include:
Star Schema
Snowflake Schema
Constellation / Integrated Schema
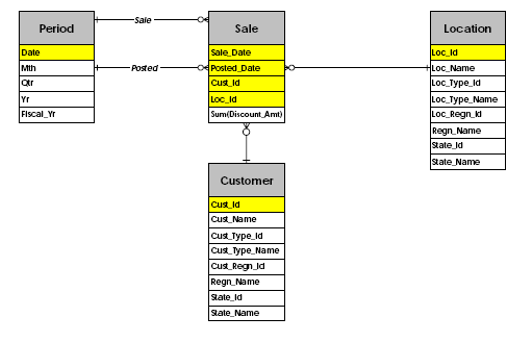
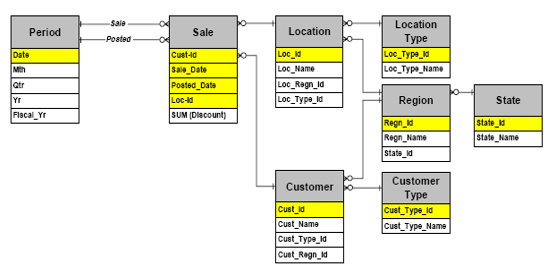
Star Schema
A star schema consists of one large central table called the fact table, and a number of smaller tables called dimension tables which radiate out from the central table
• A fact table is formed for each transaction entity. The key of the table is the combination of the keys of its associated component entities.
• A dimension table is formed for each component entity, by collapsing hierarchically related classification entities into it.
Sample Star Schema
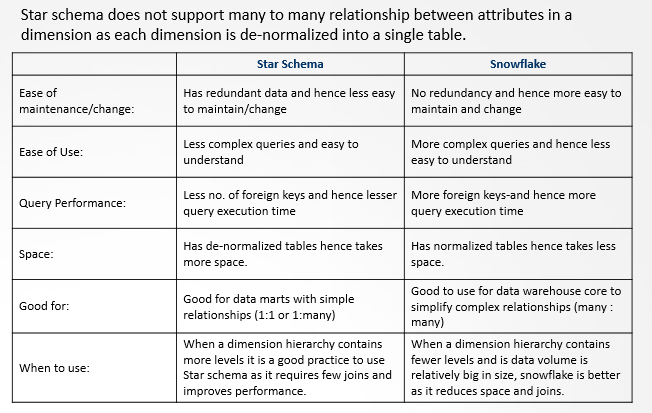
Snowflake Schema
A snowflake schema is a star schema with all hierarchies explicitly shown.
Star vs. Snowflake
Fact constellation schema
The fact constellation architecture contains multiple fact tables that share many dimension tables
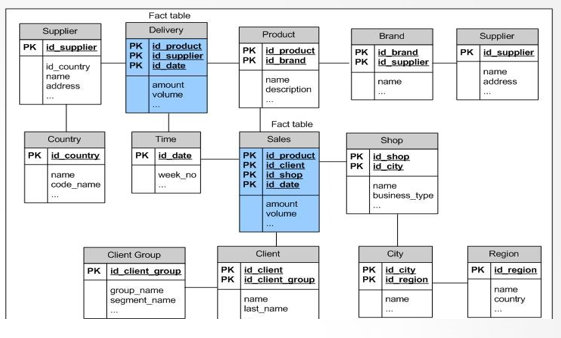
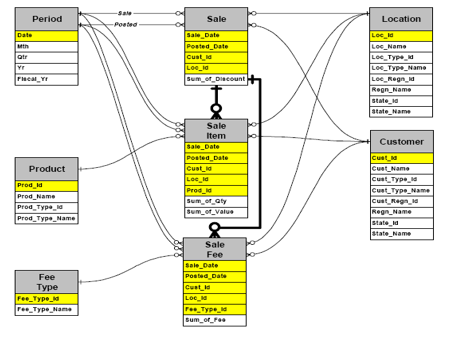
Constellation /Integrated Schema
A constellation schema consists of a set of star schemas with hierarchically linked fact tables.
Step 4. Evolution and Refinement
- Check if we can Combine any Fact Tables
- Check if we can Combine any Dimension Tables
- Handling Subtypes.
 Subscribe